POWER SPECTRUM DETERMINATION OF GIVEN SIGNAL
THEORY: The power spectrum describes the distribution of signal power over a frequency spectrum. The most frequently used way of generating a power spectrum is with using a discrete Fourier transform, but also other techniques such as the maximum entropy method can also be used. The power spectrum also can be defined because the Fourier transform of auto correlation function.
Steps involved in performing power spectrum operation for a given signal
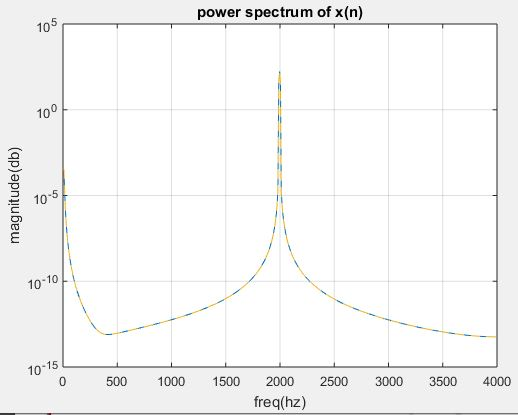
Step I: let’s consider input sequence x
Step II: And the given sampling frequency, input frequency and length of the spectrum.
Step III: In order to find power spectrum of input sequence by using matlab command spectrum.
Step IV: And plot power spectrum using specplot.
Program:
clc;
clear all;
close all;
N=1024;
fs=8000;
f=input(‘enter the frequency[1 to 5000]:’);
n=0:N-1;
x=sin(2*pi*(f/fs)*n)
pxx=spectrum(x,N);
specplot(pxx,fs);
grid on
xlabel(‘freq(hz)’);
ylabel(‘magnitude(db)’);
title(‘power spectrum of x(n)’);
Enter the frequency [1 to 5000]:2000
LOWPASS FIR FILTER IMPLEMENTATION
THEORY:
Where the FIR filters are also known as digital filters with finite impulse response. They are also referred as non-recursive digital filters because they do not have the feedback.
An FIR filter has two most important advantages when compared with an IIR design:
Firstly, there’s no feedback circuit within the structure of an FIR filter. Due to not having a feedback circuit, an FIR filter is inherently stable. Meanwhile, for an IIR filter, we’d like to see the steadiness.
Secondly, it also provide a linear-phase response. As a matter of fact, a linear-phase response is that the most frequently used advantage of an FIR filter when compared with an IIR design otherwise, for the same filtering specifications; an IIR filter will lead to a lower order.
FIR FILTER DESIGN
An FIR filter is meant by finding the coefficients and filter order that meet certain specifications, which may be within the time-domain (e.g. a matched filter) and while in the frequency domain (most common). Matched filters perform a cross-correlation between the input and a known pulse-shape. The FIR convolution may be a cross-correlation between the input and a time-reversed copy of the impulse-response. When a specific frequency response is desired, several different design methods are common:
1. Window design method
2. Frequency sampling method
3. Weighted least squares design
WINDOW DESIGN METHOD
In the window design method, one first designs a perfect IIR filter then truncates the infinite impulse response by multiplying it with a finite length window function. The result’s a finite impulse response filter whose frequency response is modified from that of the IIR filter.
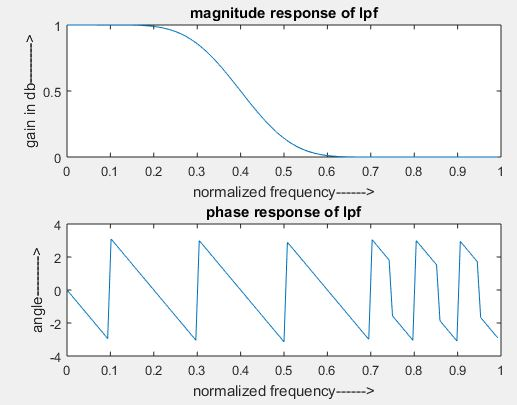
Steps involved in low pass FIR filter design:
Step I: Let’s enter the pass band frequency (fp) and stop band frequency (fq).
Step II: Get the sampling frequency (fs), length of window (n) for the low pass FIR filter.
Step III: Let’s calculate the cut off frequency, fn
Step IV: Using boxcar, hamming, blackman Commands to design window.
Step V: Design filter by using above parameters.
Step VI: To find frequency response of the filter by using matlab command freqz.
Step VII: And plot the magnitude response and phase response of the filter.
Program:
clc;
clear all;
close all;
n=20;
fp=200;
fq=300;
fs=1000;
fn=2*fp/fs;
window=blackman(n+1);
b=fir1(n,fn,window);
[H W]=freqz(b,1,128);
subplot(2,1,1);
plot(W/pi,abs(H));
title(‘magnitude response of lpf’);
ylabel(‘gain in db——–>’);
xlabel(‘normalized frequency——>’);
subplot(2,1,2);
plot(W/pi,angle(H));
title(‘phase response of lpf’);
ylabel(‘angle——–>’);
xlabel(‘normalized frequency——>’);