Theory for autocorrelation:
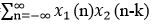
Auto Correlation Function Autocorrelation function is a measure of similarity between a signal & its time-delayed version. It is represented with R(k). While the autocorrelation function of x(n) is determined by
R11 (k) =R(k)=
Steps to perform auto correlation:
- And the given input sequence is x[n].
- Let the given impulse response of sequence h (n).
- In order to auto correlation by using the matlab command xcorr.
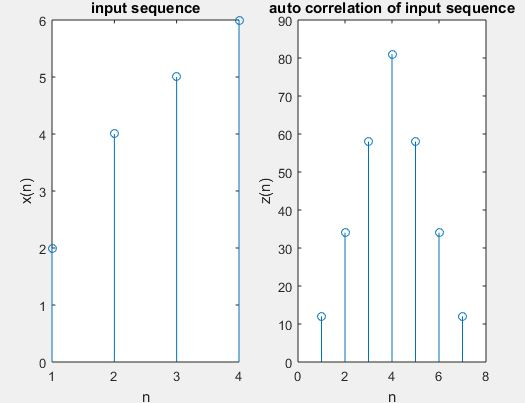
- Let’s plot the sequence x[n], h[n], z[n].
- Next step is to display the result.
Program:
clc;
close all;
clear all;
% Let’s the two input sequences
x=input(‘enter input sequence’)
subplot(1,2,1);
stem(x);
xlabel(‘n’);
ylabel(‘x(n)’);
title(‘input sequence’);
% And the auto correlation of the given input sequence
z=xcorr(x, x);
disp(‘The values of z are = ‘);
disp(z);
subplot(1,2,2);
stem(z);
xlabel(‘n’);
ylabel(‘z(n)’);
title(‘auto correlation of input sequence’);
OUTPUT:
Enter input sequence [2 4 5 6]
x = 2 4 5 6
And the values of z are =
12.0000 34.0000 58.0000 81.0000 58.0000 34.0000 12.0000
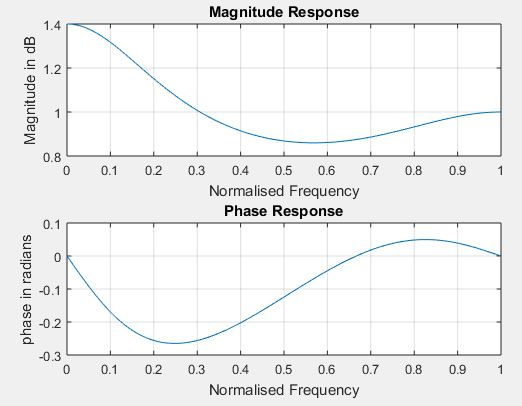
The frequency response of the signal in differential equation form:
Systems respond differently to inputs of different frequencies. Where some of the systems may amplify components with certain frequencies, and attenuate components of other frequencies. And the way system output is related to the system input with different frequencies is called the frequency response of the system. We can convert it to polar notation in the complex plane. This will provides us the magnitude and an angle. We call the angle the phase.
Amplitude Response: For each frequency, the magnitude represents the system’s tendency to amplify or attenuate the input signal.
Phase Response: The phase represents the system’s tendency to modify the phase of the input sinusoids.
Steps for obtaining frequency response of the signal:
- And the given numerator coefficients of the given transfer function or difference equation.
- And the given denominator coefficients of the given transfer function or difference equation
- Let’s pass these coefficients to matlab command freqz to find frequency response.
- In order to find magnitude and phase response by using matlab commands abs and angle.
- Let’s plot the magnitude and phase response.
Program:
clc;
clear all;
b=input(‘Enter the numerator coefficients:’);
a=input(‘Enter the denominator coefficients:’);
[h,w]=freqz(b,a);
subplot(2,1,1);
plot(w/pi,abs(h));
grid;
xlabel(‘Normalised Frequency’);
ylabel(‘Magnitude in dB’);
title(‘Magnitude Response’);
subplot(2,1,2);
plot(w/pi,angle(h));
grid;
xlabel(‘Normalized Frequency’);
ylabel(‘phase in radians’);
title(‘Phase Response’);