Theory:
Frequency analysis of discrete time signals is usually performed on digital signal processor, which may be general purpose digital computer or specially designed digital hardware. To perform frequency analysis on discrete time signal, we convert the time domain sequence to an equivalent frequency domain representation. We know that such representation is given by The Fourier transform X(ejw) of the sequence x(n). However, X(ejw) is a continuous function of frequency and therefore, It is not a computationally convenient representation of the sequence. DFT is a powerful computational tool for performing frequency analysis of discrete time signals. The N-point DFT of discrete time sequence x(n) is denoted by X(k) and is defined as.
x(n)= n)
Steps in performing operations:
- Get the input sequence.
- We can find the DFT for the input sequence using by direct equation of DFT.
- Find the IDFT using the direct equation.
- Let’s plot the DFT and IDFT for the given sequence by using matlab command stem.
- Display the above outputs.
Program:
clc;
close all;
clear all;
xn=input(‘Enter the sequence x(n)’);
ln=length(xn); %find the length of the sequence
xk=zeros(1,ln); %let’s initialize an array of the same size as that of input sequence
ixk=zeros(1,ln); let’s initialize an array of the same size as that of input sequence
%DFT of the sequence
for k=0:ln-1
for n=0:ln-1
xk(k+1)=xk(k+1)+(xn(n+1)*exp((i)*2*pi*k*n/ln));
end
end
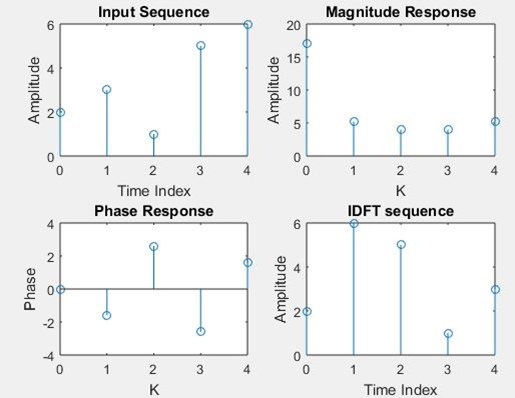
%Plotting input sequence
t=0:ln-1;
subplot(221);
stem(t,xn);
ylabel (‘Amplitude’);
xlabel (‘Time Index’);
title(‘Input Sequence’);
magnitude=abs(xk); % In order to find the magnitudes for the individual DFT points
% plot the magnitude response
t=0:ln-1;
subplot(222);
stem(t,magnitude);
ylabel (‘Amplitude’);
xlabel (‘K’);
title(‘Magnitude Response’);
phase=angle(xk); % In order to find the phases of individual DFT points % plot the magnitude
t=0:ln-1;
subplot(223);
stem(t,phase);
ylabel (‘Phase’);
xlabel (‘K’);
title (‘Phase Response’);
%IDFT of the sequence
for n=0:ln-1
for k=0:ln-1
ixk(n+1)=ixk(n+1)+(xk(k+1)*exp(i*2*pi*k*n/ln));
end
end
ixk=ixk./ln;
%code block to plot the input sequence
t=0:ln-1;
subplot(224);
stem(t,ixk);
ylabel (‘Amplitude’);
xlabel (‘Time Index’);
title (‘IDFT sequence’);