CORRELATION:
The concept correlation can be defined as similarities of two waveforms. It may determine if signal x1(t) waveform contain an amount c2x2(t) of that particular waveform x2(t) in the interval of (t1, t2). It is a measure of the degree to which two sequences are similar.Correlation is of two types cross correlation and autocorrelation.
Cross correlation:
Cross-correlation between two signals indicates what proportion one signal is said to the time-delayed version of another signal.
clc;
close all;
clear all;
% two input sequences
x=input(‘enter input sequence’);
h=input(‘enter the impulse sequence’);
subplot(2,2,1);
stem(x);
xlabel(‘n’);
ylabel(‘x(n)’);
title(‘input sequence’);
subplot(2,2,2);
stem(h);
xlabel(‘n’);
ylabel(‘h(n)’);
title(‘impulse sequence’);
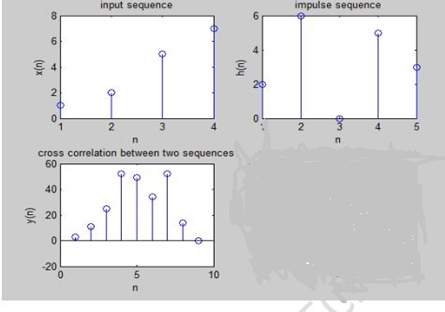
% cross correlation between two sequences
y=xcorr(x,h);
subplot(2,2,3);
stem(y);
xlabel(‘n’);
ylabel(‘y(n)’);
title(‘ cross correlation between two sequences ‘);
Autocorrelation:
The auto correlation function is a special form of cross correlation function.
clc;
close all;
clear all;
% two input sequences
x=input(‘enter input sequence’);
h=input(‘enter the impulse sequence’);
subplot(2,2,1);
stem(x);
xlabel(‘n’);
ylabel(‘x(n)’);
title(‘input sequence’);
subplot(2,2,2);
stem(h);
xlabel(‘n’);
ylabel(‘h(n)’);
title(‘impulse sequence’);
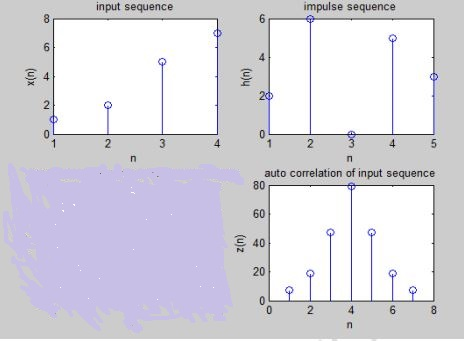
% auto correlation of input sequence
z=xcorr(x,x);
subplot(2,2,4);
stem(z);
xlabel(‘n’);
ylabel(‘z(n)’);
title(‘auto correlation of input sequence’);
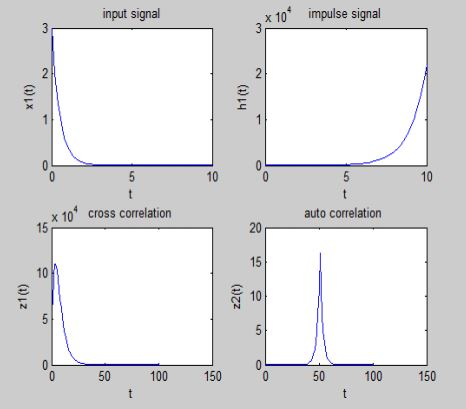
crosscorrelation between two signals
clc;
close all;
clear all;
% cross correlation between two signals
% generating two input signals
t=0:0.2:10;
x1=3*exp(-2*t);
h1=exp(t);
figure;
subplot(2,2,1);
plot(t,x1);
xlabel(‘t’);
ylabel(‘x1(t)’);
title(‘input signal’);
subplot(2,2,2);
plot(t,h1);
xlabel(‘t’);
ylabel(‘h1(t)’);
title(‘impulse signal’);
% cross correlation
subplot(2,2,3);
z1=xcorr(x1,h1);
plot(z1);
xlabel(‘t’);
ylabel(‘z1(t)’);
title(‘cross correlation ‘);
% auto correlation
subplot(2,2,4);
z2=xcorr(x1,x1);
plot(z2);
xlabel(‘t’);
ylabel(‘z2(t)’);
title(‘auto correlation ‘);