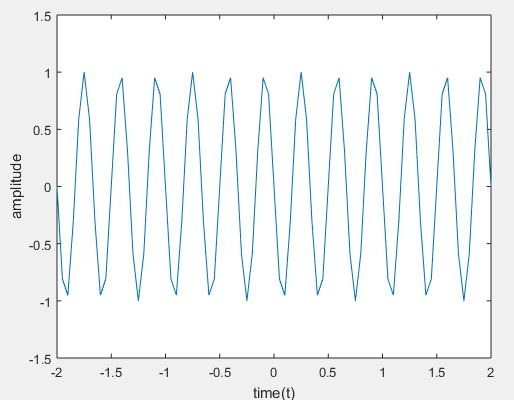
The DTMF stands for “Dual Tone Multi-Frequency”, and maybe a method of representing digits with tone frequencies, so as to transmit them over an analog communications network, for instance, a telephone line. In telephone networks, DTMF signals are wont to encode dial trains and other information. Dual-tone Multi-Frequency (DTMF) signaling is widely used for voice communications control and is mostly used worldwide in modern telephony to configure switchboards and to dial numbers. It is also utilized in systems like voice mail, electronic message, and telephone banking. The DTMF signal is considered as the sum of two sinusoids – or tones – with frequencies taken from two mutually exclusive groups. Where these frequencies are chosen to stop any harmonics from being incorrectly detected by the receiver as another DTMF frequency. while each pair of tones consist of one set frequency of the low group (697 Hz, 770 Hz, 852 Hz, 941 Hz) and another set frequency of the high group ( 1336 Hz, 1477Hz,1209 Hz) and represents a unique symbol.
Program:
clc;
clear all;
close all;
t = -2:0.05:2;
x=input(‘enter the input number’);
fr1=697;
fr2=770;
fr3=852;
fr4=941;
fc1=1209;
fc2=1336;
fc3=1477;
fc4=1633;
y0 = sin(2*pi*fr4*t) + sin(2*pi*fc2*t); % 0
y1 = sin(2*pi*fr1*t) + sin(2*pi*fc1*t); % 1
y2 = sin(2*pi*fr1*t) + sin(2*pi*fc2*t); % 2
y3 = sin(2*pi*fr1*t) + sin(2*pi*fc3*t); % 3
y4 = sin(2*pi*fr2*t) + sin(2*pi*fc1*t); % 4
y5 = sin(2*pi*fr2*t) + sin(2*pi*fc2*t); % 5
y6 = sin(2*pi*fr2*t) + sin(2*pi*fc3*t); % 6
y7 = sin(2*pi*fr3*t) + sin(2*pi*fc1*t); % 7
y8 = sin(2*pi*fr3*t) + sin(2*pi*fc2*t); % 8
y9 = sin(2*pi*fr3*t) + sin(2*pi*fc3*t); % 9
y_start = sin(2*pi*fr4*t) + sin(2*pi*fc1*t); % *
y_canc = sin(2*pi*fr4*t) + sin(2*pi*fc3*t); % #
if (x==1)
plot(t,y1)
xlabel(‘time(t)’)
ylabel(‘amplitude’)
elseif (x==2)
plot(t,y2)
xlabel(‘time(t)’)
ylabel(‘amplitude’)
elseif (x==3)
plot(t,y3)
xlabel(‘time(t)’)
ylabel(‘amplitude’)
elseif (x==4)
plot(t,y4)
xlabel(‘time(t)’)
ylabel(‘amplitude’)
elseif (x==5)
plot(t,y5)
xlabel(‘time(t)’)
ylabel(‘amplitude’)
elseif (x==6)
plot(t,y6)
xlabel(‘time(t)’)
ylabel(‘amplitude’)
elseif (x==7)
plot(t,y7)
xlabel(‘time(t)’)
ylabel(‘amplitude’)
elseif (x==8)
plot(t,y8)
xlabel(‘time(t)’)
ylabel(‘amplitude’)
elseif (x==9)
plot(t,y9)
xlabel(‘time(t)’)
ylabel(‘amplitude’)
elseif (x==0)
plot(t,y0)
xlabel(‘time(t)’)
ylabel(‘amplitude’)
elseif (x==11)
plot(t,y_start)
xlabel(‘time(t)’)
ylabel(‘amplitude’)
elseif (x==12)
plot(t,y_canc)
xlabel(‘time(t)’)
ylabel(‘amplitude’)
else
disp(‘enter the correct input’)
end