Where has IIR filters are digital filters with infinite impulse response. Unlike FIR filters, they have the feedback (a recursive a part of a filter) and are mentioned as recursive digital filters, therefore. For this reason, IIR filters have far better frequency responses than FIR filters of an equivalent order. Unlike FIR filters, their phase characteristic isn’t linear which may cause a drag to the systems which require phase linearity. For this reason, it isn’t preferable to use IIR filters in digital signal processing when the phase is of the essence. Otherwise, when the linear phase characteristic isn’t important, that is typical of IIR filters only. FIR filters don’t have such a drag as they are doing not have the feedback. For this reason, it’s always necessary to see after the planning process whether the resulting IIR filter is stable or not.
IIR FILTER DESIGN
For the given specifications to style a digital IIR filter, first we’d like to style analog filter (Butterworth or chebyshev). The resultant analog filter is transformed to digital filter by using either “Bilinear transformation or Impulse Invariant transformation”
Steps for performing IIR filter
Step I: while enter the pass band ripple (rp) and stop band ripple (rs).
Step II: Let’s enter the pass band frequency (wp) and stop band frequency (ws).
Step III: After we get the sampling frequency (fs).
Step IV: Next calculate normalized pass band frequency, and normalized stop band frequency w1 and w2 respectively.
Step V :And make use of the following function to calculate order of filter Butterworth filter order [n,wn]=buttord(w1,w2,rp,rs ) Chebyshev filter order [n,wn]=cheb1ord(w1,w2,rp,rs)
Step VI : Let’s Design an nth order digital low pass Butterworth or Chebyshev filter using the following statements. Butterworth filter [b, a]=butter (n, wn) Chebyshev filter [b,a]=cheby1 (n, 0.5, wn)
Step VII : To find the digital frequency response of the filter by using ‘freqz( )’ function
Step VIII : Next calculate the magnitude of the frequency response in decibels (dB) mag=20*log10 (abs (H))
Step IX : To plot the magnitude response [magnitude in dB Vs normalized frequency]
Step X : And calculate the phase response using angle (H) S
Step XI : To plot the phase response [phase in radians Vs normalized frequency (Hz)].
Program:
clc;
clear all;
close all;
disp(‘enter the IIR filter design specifications’);
rp=input(‘enter the passband ripple’);
rs=input(‘enter the stopband ripple’);
wp=input(‘enter the passband freq’);
ws=input(‘enter the stopband freq’);
fs=input(‘enter the sampling freq’);
w1=2*wp/fs;w2=2*ws/fs;
[n,wn]=buttord(w1,w2,rp,rs,’s’);
disp(‘Frequency response of IIR HPF is:’);
[b,a]=butter(n,wn,’high’,’s’);
w=0:.01:pi;
[h,om]=freqs(b,a,w);
m=20*log10(abs(h));
an=angle(h);
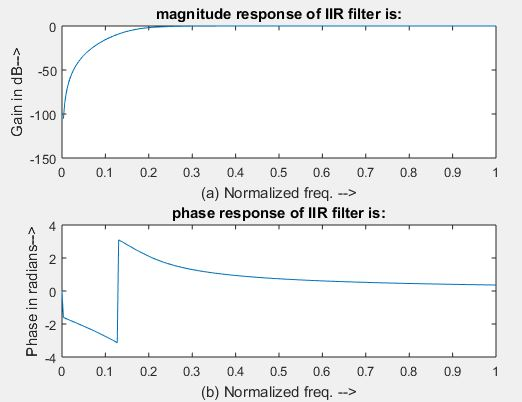
figure, subplot(2,1,1);plot(om/pi,m);
title(‘magnitude response of IIR filter is:’);
xlabel(‘(a) Normalized freq. –>’);
ylabel(‘Gain in dB–>’);
subplot(2,1,2);plot(om/pi,an);
title(‘phase response of IIR filter is:’);
xlabel(‘(b) Normalized freq. –>’);
ylabel(‘Phase in radians–>’);
output:
enter the IIR filter design specifications
enter the passband ripple13
enter the stopband ripple50
enter the passband freq1200
enter the stopband freq250
enter the sampling freq6000