GRAPHICS IN MATLAB
There are many different ways to manipulate graphics, for such the commands may include i.e., type help graphics for general graphics, while help graph2d is used for two dimensional command and for specialized and three dimensions the commands are help graphg3d, help specgraph.
Two-dimensional graphics:
Their two types of plotting in two dimensional graphs one is parametric and another one is contour or implicit plotting.
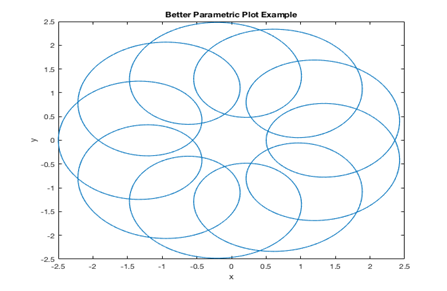
Parametric plots:
In a parametric plot, you give both the x and y coordinates of each point as a function of a third parameter, let us consider the parametric example.
r= linspace(0,4*pi,1000)
x=1.5*cos(t)-cos(10*r);
y=1.5*sin®-sin(10*t);
plot(x,y);
x label(‘x’);
y label(‘y’);
title(‘better parametric plot example’)
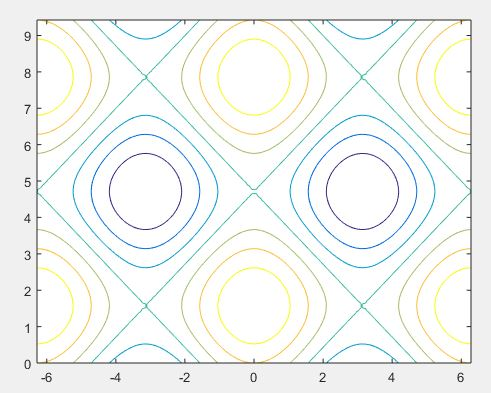
Contour plot:
A contour of a function of two variables may be a curve along which the function features a constant value. Contour lines are used for creating contour maps by joining points of equal elevation above a given level, like mean water level.
A command meshgrid is used to provide grids for the rectangular regions. While the grid used by contour to produce the contour plot for the given region.
a= linspace(-2*pi,2*pi);
b = linspace(0,3*pi);
[a,b] = meshgrid(a,b);
C= cos(a)+sin(b);
contour(a,b,C)
Three dimensional plots:
In three dimensional plots they have three vectors in the same graph (x, y,z) mainly there are five different type of three dimensional plot in matlab. They are;
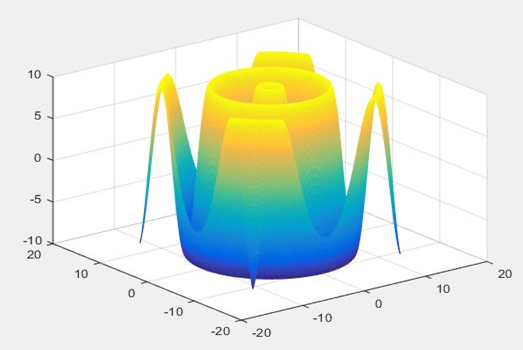
Mesh plot:
The mesh plotting function is employed to display the mesh plot. Which produces an wireframe surface where the lines connecting the defining points are colored.
[x,y] = meshgrid(-12:0.1:12);
t = sqrt(x.^2+y.^2);
z =(10*sin(t));
mesh(x,y,z)
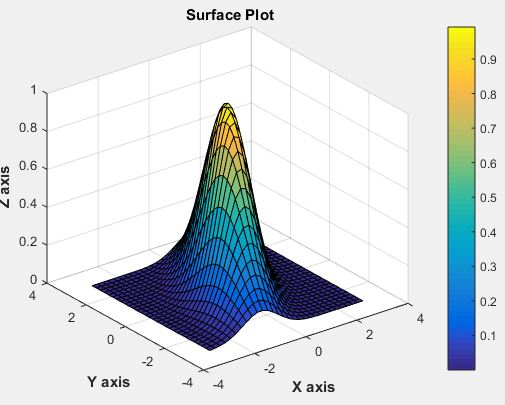
Surface three dimensional plot:
Which is similar to mesh plot main different between them is in surface path the convecting lines and faces will be displayed in dark color. Let us consider the example.
[x,y] = peaks(30);
z = exp(-0.7*(x.^2+0.5*(x-y).^2));
surf(x,y,z);
xlabel(‘\bf X axis’);
ylabel(‘\bf Y axis’);
zlabel(‘\bf Z axis’);
title(‘\bf Surface Plot’)
colorbar