Multiple Functions On Same Graph:
In matlab we can draw multiple functions on the same graph by considering some basic colors.
Colors code
White w
Blue b
Cyan c
Black k
Green g
Magenta m
Yellow y
Red r
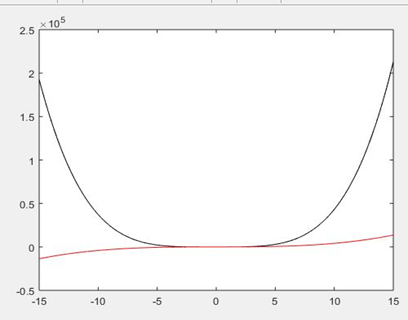
Let us consider a script for two polynomials.
g(x)= 4x4+3x3+2x2+2x+9
h(x)=4x3+9x+2
x=[-15:0.01:15];
g=4*x.^4 + 3* x.^3 + 2 * x.^2 + 2 * x + 9
h=4 * x.^3 + 9 * x + 2;
Plot(x, g, ‘k’, x, h, ‘r’)
When you run the file you will output as shown in below.
AXIS SETTING:
In order to provide minimum and maximum values for x and y axis by considering the axis command. With axis command allow us to set axis scale.
Syntax will be:
axis ([xmin xmax ymin ymax])
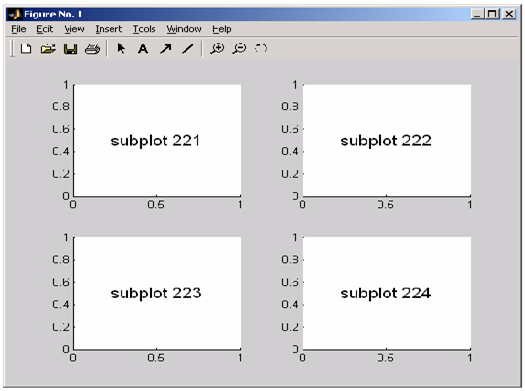
FOR GENERATING SUBPLOT:
Subplot in matlab is used to divide the current figure and allow us to plot multiple figures in the m rows and n column.
Syntax for matlab
Subplot (m, n, p)
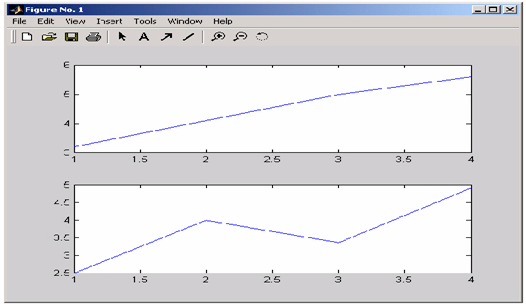
Let us consider a example for plotting
In order to plot the income in the top half of the figure and outgo in the bottom half of the figure,
income = [3.2 4.1 5.0 5.6];
outgo = [2.5 4.0 3.35 4.9];
subplot(2,1,1); plot(income)
subplot(2,1,2); plot(outgo)
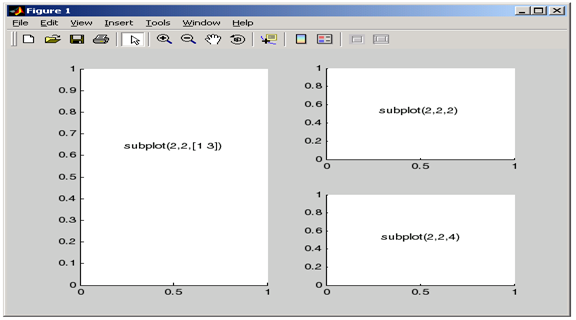
Below figure shows four subplot regions
The following combinations produce asymmetrical arrangements of subplots.
subplot(2,2,[1 3])
subplot(2,2,2)
subplot(2,2,4)